Abstract
Aim: To describe a novel neural network based oral precancer (oral submucous fibrosis; OSF) stage detection method.
Method: The wavelet coefficients of transmission electron microscopy images of collagen fibres from normal oral submucosa and OSF tissues were used to choose the feature vector which, in turn, was used to train the artificial neural network.
Results: The trained network was able to classify normal and oral precancer stages (less advanced and advanced) after obtaining the image as an input.
Conclusions: The results obtained from this proposed technique were promising and suggest that with further optimisation this method could be used to detect and stage OSF, and could be adapted for other conditions.
Introduction
Cancers of the oral cavity are increasing at an alarming rate and have been reported to account for approximately 220 000 new cases each year for men (5% of all cancers) and about 90 000 for women (2% of all cancers). Two third of these cases are recorded in developing countries. A high incidence of oral cancer is seen in the Indian subcontinent as a result of the late diagnosis of potential precancerous lesions and conditions. Oral submucous fibrosis (OSF) is an insidious chronic progressive precancerous condition of the oral cavity and oropharynx with a high degree of malignant potential. A large proportion of these precancerous lesions convert to squamous cell carcinoma, the malignant transformation rate being in the order of 7.6%. OSF is prevalent in the Indian subcontinent in all age groups and across all socioeconomic strata, but the incidence exhibits regional and interregional variations (0.2–4.57%), being highest in Southern India. This disease is now a public health issue in many parts of the world including the UK, South Africa, and many southeast Asian countries.
“The simple pathological evaluation procedure currently used for oral submucous fibrosis does not provide a quantitative analysis of the vital changes in the tissues”
The aetiology of OSF is not well understood, but maximum importance has been given to the chewing of areca nut in isolation or in combination with betel leaf or other tobacco products. Arecoline, an active alkaloid found in betel nuts, stimulates fibroblasts to increase collagen production by 150%.However, available data suggest that a multifactorial mechanism is involved in the pathogenesis of OSF, including areca nut chewing, the ingestion of chillies, and deficiencies of nutrients, trace metals, and vitamins, in addition to hypersensitivity to various dietary constituents and genetic and immunological predisposition.
Presently, no specific diagnostic test is available for OSF except for histopathological studies. The pathological status of OSF is mainly assessed by light microscopic studies of oral biopsies and clinical evaluation. Microscopically, the main features of OSF are less vascularised collagenous connective tissue with occasional progressive atrophy of the muscle fibres, a minimal to moderate degree of chronic inflammatory infiltration, and atrophic overlying epithelium with a variable degree of dysplastic changes.
The main histopathological characteristic of OSF is the deposition of collagen in the subepithelial connective tissue leading to epithelial atrophy. It has been found that exposure of buccal mucosal fibroblasts to alkaloid may result in the accumulation of collagen. Reduced degradation of the α1(I) collagen trimer synthesised by OSF fibroblasts may induce alteration of the ratio of α1(I) to α2(I) chains. Collagenase activity has been found to be lower in OSF than in normal oral mucosa. These findings suggest that OSF should be considered as a collagen metabolic disorder resulting from alkaloid exposure and individual variations in collagen metabolism.
The simple pathological evaluation procedure currently used does not provide a quantitative analysis of the vital changes in the tissues—that is, epithelial dysplastic changes, subepithelial fibrosis, etc. Accordingly, histopathological grading of the disease state is also empirical. Ultrastructural studies on collagen in oral submucous fibrosis qualitatively noted variations in the width and periodicity of fibrillar collagen between diseased and normal tissue specimens. Therefore, our present study analyses transmission electron micrography (TEM) images of subepithelial fibrillar collagen in early and advanced stages of OSF and compares them with those obtained from normal oral mucosa by applying a novel computer aided technique. In this computer aided diagnostic (CAD) approach, a specific attempt is made to grade OSF stages in a quantitative manner, to minimise the ambiguity in the presently accepted empirical (clinical and histopathological) diagnostic procedure of OSF. This quantitative approach may finally lead to the identification of suitable biomarkers for the more specific grading of OSF.
CAD refers to a diagnostic process during which a radiologist uses computer analysis as a diagnostic aid to achieve a more accurate interpretation of the disease state. The precancer diagnostic importance of the CAD system coupled with wavelet ANN (artificial neural network) is studied by analysing collagen in OSF and normal oral mucosa. The wavelet transformation technique is ideal for obtaining information from signals that are aperiodic, noisy, intermittent, or transient. ANN is an important statistical tool that can improve the characterisation of pathological images especially of precancer and cancers. There are only a few reports on the successful applications of machine learning to precancer diagnosis. Thus, our study could strengthen the foundation of ANN in CAD applications.
MATERIALS AND METHODS
Selection of patients
Clinically diagnosed patients with OSF were subjected to incisional biopsy with their previous consent at the department of oral and maxillofacial pathology, R Ahmed Dental College and Hospital, Kolkata, India for histopathological evaluation. Portions of each oral mucosal biopsy from the clinically and histologically confirmed cases of early (n  = 52) and advanced (n = 58) stages of OSF were taken for the analysis of fibrillar collagen ultrastructure by TEM. Normal healthy volunteers (n = 35) of similar age and food habits, but without the oral habit, were also included in our study.
= 52) and advanced (n = 58) stages of OSF were taken for the analysis of fibrillar collagen ultrastructure by TEM. Normal healthy volunteers (n = 35) of similar age and food habits, but without the oral habit, were also included in our study.Clinical classification of OSF stages
The classification/grading of OSF was carried out according to the degree of trismus, which directly correlates with the degree of fibrosis, progression of the disease, and location of the OSF lesion in the oral mucosa. Trismus, or reduction in the overall mouth opening, is one of the most reliable manifestations of OSF, and it has been a cardinal clinical feature for grading patients into different groups. The gradation of trismus and in turn the gradation of the disease process was assessed by measuring the distance between the incisal edges of the upper and lower central incisal teeth—the interincisal distance (IID)—using vernier calipers as follows: mild or moderate grade (IID, ![[gt-or-equal, slanted]](http://www.ncbi.nlm.nih.gov/corehtml/pmc/pmcents/ges.gif) 1.5 but < 3.5 cm) and severe grade (IID, < 1.5 cm), considering IID 3.5 as normal.
1.5 but < 3.5 cm) and severe grade (IID, < 1.5 cm), considering IID 3.5 as normal.
1.5 but < 3.5 cm) and severe grade (IID, < 1.5 cm), considering IID 3.5 as normal.TEM study
Biopsy samples (1 × 2 mm) were fixed in primary fixative (2.5% glutaraldehyde in 0.12M phosphate buffer) for 48 hours at 4°C. The tissues were then washed in 0.12M phosphate buffer and postfixed in 2% osmium tetroxide for two hours at room temperature with constant shaking. After postfixation, tissues were dehydrated in graded alcohol and processed for spur embedding. Ultrathin sections were cut on the Nova Ultratome (LKB, Sweden), collected on copper grids, and stained with uranyl acetate and lead citrate. Sections were observed under TEM (JEOL, Japan; 100CX TEM) at 60 kV.
Wavelet ANN based analysis of TEM collagen images
We have devised a novel wavelet ANN based scheme to detect and grade the stages of OSF (advanced and less advanced) by analysing TEM images of subepithelial collagen fibres from normal healthy volunteers and patients with OSF. Figure 1A1A–F–F shows representative images at a magnification of ×64 000.

Figure 1
Transmission electron microscopy images of collagen. (A) Normal transverse section (TS); (B) TS of less advanced oral submucous fibrosis (OSF); (C) TS of advanced OSF; (D) normal longitudinal section (LS); (E) LS of less advanced OSF; (F) LS of advanced OSF.
Accordingly, a set of 145 random samples (64 × 64 pixels) of subepithelial collagen image data was used to make a large training set. The depth of all the images was 8. Two hundred and fifty six different shades were needed to represent all the colours from complete black to absolute white. This 64 × 64 pixel image was decomposed into four levels using the “HAAR” wavelet. Both the approximate and detail coefficients were extracted for each level. The feature vector was chosen judiciously with the combination of these approximate and detail coefficients. These feature vectors were used to train the ANN. During the test, the images were decomposed into 64 × 64 non-overlapping pixel blocks. The approximate and detail coefficients were extracted for each block. These data were then fed into the network. The output can be of three different types: advanced and less advanced stage of OSF and normal. Based on the number of blocks in each of these three classes, a decision will have been taken for the test image.
Wavelet and sub-band decomposition and feature vector extraction (http://www.mathworks.com/access/helpdesk/toolbox/wavelet/wavelet.shtml)
In continuous signal analysis, a signal g(t) is often represented by a weighted sum of basis functions:

where ψi(t) is the basis function and ci is the coefficient.
Multiresolution analysis can be done using continuous and discrete wavelet transforms (CWT and DWT). To define CWT, a scaled and translated version of the basis function, called the mother wavelet, is used to achieve the constant Q requirement. Considering a real band pass filter with impulse responseψ(t) of zero mean:

The CWT is defined as:
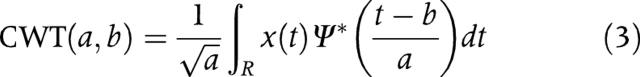
where ψ*(t) is the complex conjugate of ψ(t), aɛR+, and bɛR.
Equation 3 can be rewritten as:
where:

In the case of discrete signals the theory of filter banks and their application to sub-band signal decomposition must be briefly discussed. For example, a simple two channel filter bank structure (fig 22)) is used to explain the decomposition and reconstruction of a signal using DWTs.

Figure 2 Wavelet decomposition and reconstruction of a discrete signalx(n).
A discrete time signal x(n) is applied to a pair of filters. A lower resolution signal is obtained by convoluting x(n) with a half band low pass filter having an impulse response h2(n). The half band signal can be made full band by down sampling with a factor of two (doubling the scale by a factor of two in the analysis). The z-transform Y2(z) of the resulting signal y2(n) can be expressed as:

where H2(z) and X2(z) are the z-transform of h2(n) and x(n). Compared with the original signal x(n), the filtered signal y2(n) is reduced in resolution by a factor of two as a result of low pass filtering and doubled in scale as a result of down sampling. In a similar manner, it is possible to compute the added details of a signal as a high pass version of x(n) using a filter with impulse response h1(n) followed by down sampling. Wavelet analysis became popular in the multiresolution analysis of biomedical images because of its ability to obtain smooth approximation at different levels.
The same sub-band decomposition can be carried out in the case of two dimensional signals. As mentioned in the previous section, large numbers of 64 × 64 pixel image templates were taken to extract the feature vector for training the ANN. Figure 3A3A–D–D shows four such training samples, two images of normal samples and two of advanced stage OSF. These sample images have been decomposed by HAAR wavelets into four levels. In each level, there are three sets of detail coefficients: horizontal (Hi), vertical (Vi), and diagonal (Di); i = 1, 2, 3, 4, as shown in fig 44.. The dimensions of Hi, Vi, and Di are 64*2−i × 64*2−i pixels. Hi, Vi, and Di were extracted using the “detcoef2” function of MATLAB 5.1. The four approximation coefficients, Ai, were extracted from the four levels using “appcoef2”. The frobenious norm was computed for Hi, Vi, Di, and Ai and denoted as:
= 1, 2, 3, 4, as shown in fig 44.. The dimensions of Hi, Vi, and Di are 64*2−i × 64*2−i pixels. Hi, Vi, and Di were extracted using the “detcoef2” function of MATLAB 5.1. The four approximation coefficients, Ai, were extracted from the four levels using “appcoef2”. The frobenious norm was computed for Hi, Vi, Di, and Ai and denoted as:
Figure 3 Training 64 ×64 pixel sample transmission electron microscopy image of oral subepithelial collagen. (A) Normal transverse section (TS); (B) normal longitudinal section (LS); TS of advanced stage oral submucous fibrosis (OSF); LS of advanced stage OSF.

Figure 4
Wavelet decomposition of 64 × 64 pixel training image sample.
The element of the feature vector (FV) is the frobenious norm of Hi, Vi, Di, and Ai.
i = 1,2,3,4 where κ is set at 0.001.
= 1,2,3,4 where κ is set at 0.001.Multilayered perceptron feed forward neural network
Figure 55 shows a representative multilayered perceptron feed forward network. Each node represented by the box is called a perceptron.

Figure 5
Multilayered perceptron model.
It has been proved that a three layered network can represent a non-linear function of any order. The numbers of layers and numbers of nodes in the hidden layer are guided by many practical aspects, such as redundancy, number of input training sets, spurious oscillations, etc. However, the most crucial part of an ANN based model is to train the network. The most widely studied and used training algorithm is the so called back propagation technique, which is robust and reliable. The main problem with neural network training is to devise a method of updating the representative weights that minimises the error. However, the updating of the weights has been done here by the Levenberg-Marquardt algorithm. The Levenberg-Marquardt algorithm performs much better with some knowledge of the process, so that quick convergence is obtained with a very small error.
Figure 66 shows the structure of the network. In this figure, vij and wpq denote the weights for the successive layers. The basic purpose of training a network is to optimise vij and wpq with respect to a particular set of input–output training patterns.

Figure 6
Weight vectors in the multilayered perceptron feed forward network.
The responses at the hidden nodes bj = 1,2…p are calculated by evaluating the contributions from all the input nodes through a non-linear mapping function:
= 1,2…p are calculated by evaluating the contributions from all the input nodes through a non-linear mapping function:

where the function f(•) chosen is the “tansig” function of MATLAB 5.1.
The tansig function is given by:

θj is the bias at the jth hidden layer node and ai is the input vector. Similarly, ck, k = 1,2,…q is calculated using:
= 1,2,…q is calculated using:

where τk is the bias at the kth output layer node.
The function “trainlm” in the neural network toolbox in MATLAB 5.1 was used to train the network. It uses a mixture of the Gauss-Newton method and a gradient descent technique for optimisation of the weights, wjk and vij.
The Levenberg-Marquardt weight update rule is:
where J is the Jacobian matrix of derivatives of each error to each weight, μ is a scalar, I is the identity matrix, and e is an error vector. Training continues until the error goal is met and the minimum error gradient occurs.
Training/testing by ANN
In our present study, a three layer ANN was used. A single hidden layer with four neurones was found to be sufficient for training (fig 77).). The maximum number of epochs was fixed at 400 and the sum squared error goal was kept at 10−5. The learning rate and minimum feasible gradient were chosen as 0.01 and 0.05, respectively. Detailed discussions of these parameters are available in Demuth and Beale.

Figure 7
Convergence of artificial neural network training.
RESULTS
After successful training, several images from different patients were tested. The feature vector was extracted from each of the contiguous 64 × 64 pixel blocks by wavelet decomposition. These test feature vectors were fed into the ANN. Figs 88–10 show the ANN outputs for three different test images. The target output has three different states, denoted as −1, 0, and +1, which represent normal, less advanced stage, and advanced stage OSF, respectively. In the case of untrained test samples, the ANN output for a particular 64 × 64 pixel block may not map exactly to one of the three states—for example, a sample of advanced state OSF may produce an output of +0.9 instead of +1.0—so that bands need to be defined around these three states. These bands corresponding to normal, less advanced, and advanced stages have been designated as follows: if the output of a 64 × 64 pixel block is less than −0.5, the block is categorised as “normal”; if the output is between −0.5 and +0.5 is categorised as “less advanced”; and if the output is greater than +0.5 it is categorised as “advanced”.

Figure 8
Artificial neural network (ANN) output for an image of normal cells.

Figure 9
Artificial neural network (ANN) output for an image of less advanced stage of oral submucous fibrosis.

Figure 10
Artificial neural network (ANN) output for an image of advanced stage oral submucous fibrosis.
In fig 88 a normal image has been tested and the target output of each 64 × 64 pixel block is set as −1. There are 60 blocks of 64 × 64 pixels. Of these 60 blocks, only nine are misclassified. Similarly, in fig 99the test image is a less advanced stage of disease and the target output is set at 0. Of the total number of 297 blocks, 26 blocks are wrongly classified, whereas in fig 1010,, the test image is advanced stage of the disease and the target output is set as +1. Of 60 blocks only six do not show the correct signature.
To provide a measure of the efficiency of the proposed ANN technique, the properly classified block index (PCBI) has been computed for all the test images. PCBI has been defined as follows:

where Np and NT are the total number of properly classified blocks and the total number of 64 × 64 pixel blocks in the test image. After classifying the blocks into three states −1, 0, and +1, the number of blocks in each state has been computed. If NP−1, NP0, and NP1 are the number of 64 × 64 pixel blocks classified as normal, less advanced, and advanced, respectively, the number of properly classified blocks is:
Based on the magnitude of the PCBI, the final diagnosis is performed on the nature of the test images. A binary decision is taken based on the PCBI. If the PCBI is greater than 50% (fig 1111),), the wavelet ANN based system can identify the correct diagnosis. In table 11,, 16 test images were used to check the diagnostic ability of the proposed wavelet ANN based system: all test images were diagnosed properly by the proposed system.

Figure 11 Binary decision for oral submucous fibrosis stage detection. PCBI, properly classified block index.
DISCUSSION
Our study proposes a novel ANN based CAD technique to identify the progressive stages of the oral precancerous condition OSF. TEM images of oral subepithelial collagen fibres (test images) are subdivided into 64 × 64 pixel contiguous blocks and these blocks undergo wavelet decomposition. The wavelet coefficients are used as feature vectors. In the less advanced stage of the disease, some of the blocks show the signature of the normal collagen image, whereas others have the signature of advanced stage OSF. As a result, the false detection rate is high in the less advanced stage of the disease but the PCBI is always greater than 50%. Because the final decision is taken based on the magnitude of the PCBI, it always leads to the correct diagnosis.
It should be mentioned that from these sample images 16 features were extracted using wavelet transformation. However, all 16 features may not contribute equally to classifying the image characteristics. There are some common features and some unwanted features resulting from noise that can mislead both the training process and the decision making process. Therefore, in future studies the feature set could be selectively weighted or restricted using a suitable technique, so that unwanted or misleading features could be deactivated or isolated.
Abbreviations
- ANN, artificial neural network
- CAD, computer aided diagnosis
- CWT, continuous wavelet transform
- DWT, discrete wavelet transform
- IID, interincisal distance
- OSF, oral submucous fibrosis
- PCBI, properly classified block index
- TEM, transmission electron microscopy
REFERENCES
1. Parkin DM, Pisani P, Ferlay J. Estimates of the worldwide incidence of twenty five major cancers in 1990. Int J Cancer 1999;80:827–41.2. Aziz SR. Oral submucous fibrosis: an unusual disease. J N J Dent Assoc 1997;68:17–19.3. Canniff JP, Harvey W, Harris M. Oral submucous fibrosis: its pathogenesis and management. Br Dent J 1986;160:429–34.4. Seedat HA, van Wyk CW. Betel-nut chewing and submucous fibrosis in Durban. S Afr Med J1988;74:568–71.5. Maher R, Lee AJ, Warnakulasuriya KA, et al. Role of areca nut in the causation of oral submucous fibrosis: a case–control study in Pakistan. J Oral Pathol Med 1994;23:65–9.6. Zain RB, Ikeda N, Razak IA, et al. A national epidemiological survey of oral mucosal lesions in Malaysia. Community Dent Oral Epidemiol 1997;25:377–83.7. Regezi JA, Sciubba JJ. Oral pathology: clinical pathologic correlations. London: WB Saunders, 1999.8. Liao PH, Lee TL, Yang LC, et al. Adenomatous polyposis coli gene mutation and decreased wild-type p53 protein expression in oral submucous fibrosis: a preliminary investigation. Oral Surg Oral Med Oral Pathol Oral Radiol Endod 2001;92:202–7.9. Canniff JP, Harvey W. The aetiology of oral submucous fibrosis: the stimulation of collagen synthesis by extracts of areca nut. Int J Oral Surg 1981;10 (suppl 1) :163–7.10. van Wyk CW, Grobler-Rabie AF, Martell RW, et al. HLA-antigens in oral submucous fibrosis. J Oral Pathol Med 1994;23:23–7.11. Paul RR, Chatterjee J, Das AK, et al. Altered elemental profile as indicator of homeostatic imbalance in pathogenesis of oral submucous fibrosis. Biol Trace Elem Res 2002;87:45–56.12. Paul RR, Chatterjee J, Das AK, et al. Zinc and iron as bioindicators of precancerous nature of oral submucous fibrosis. Biol Trace Elem Res 1996;54:213–30.13. Pindborg JJ, Sirsat SM. Oral submucous fibrosis. Oral Surg Oral Med Oral Pathol 1966;22:764–79.14. Hardie J. Oral submucous fibrosis. A review with case reports. J Can Dent Assoc 1987;53:389–93.15. Huang IY, Shieh TY. Collagen content and types in oral submucous fibrosis. Gaoxiong Yi Xue Ke Xue Za Zhi 1989;5:162–71.16. Harvey W, Scutt A, Meghji S, et al. Stimulation of human buccal mucosa fibroblasts in vitro by betel-nut alkaloids. Arch Oral Biol 1986;31:45–9.17. Kuo MY, Chen HM, Hahn LJ, et al. Collagen biosynthesis in human oral submucous fibrosis fibroblast cultures. J Dent Res 1995;74:1783–8.18. Shieh TY, Yang JF. Collagenase activity in oral submucous fibrosis. Proc Natl Sci Counc Repub China B 1992;16:106–10.19. van Wyk CW, Seedat HA, Phillips VM. Collagen in submucous fibrosis: an electron microscopic study. J Oral Pathol Med 1990;19:182–7.20. Dayhoff JE, Deleo JM. Artificial neural network—opening the black box. Cancer 2001;91:1615–35.21. Kappen HJ, Neijt JP. Advanced ovarian cancer: neural network analysis to predict treatment outcome. Ann Oncol 1993;4 (suppl 4) :31–4.22. Maclin P, Dempsey J. Using an artificial neural network to diagnose hepatic masses. J Med Syst1992;16:215–25.23. Ravdin PM, Clark GM. A practical application of neural network analysis for predicting outcome of individual breast cancer patients. Breast Cancer Res Treat 1992;22:285–93.24. Wilding P, Morgan MA, Grygotis AE, et al. Application of back propagation neural networks to diagnosis of breast and ovarian cancer. Cancer Lett 1994;74:143–53.25. Wu Y, Giger ML, Doi K, et al. Artificial neural networks in mammography: application to decision making in the diagnosis of breast cancer. Radiology 1993;187:81–7.26. Chatterjee J, De K, Basu SK, et al. Collagen, zinc and iron contents of rat skin irradiated with chronic low-dose X-ray. Indian J Med Res 1993;98:243–7.27. Daubechies I. Ten lectures on wavelets. Philadelphia: SIAM, 1992.28. Vellerli M, Herley C. Wavelet and filter banks: theory and design. IEEE Trans Signal Process1992;40:2207–32.29. Mishra A, Dutta PK, Ghosh MK. Non-rigid cardiac motion quantification from 2-D image sequences based on wavelet synthesis. Image and Vision Computing 2001;19:929–39.30. Withdrawn.31. Cybenko G. Approximation by superpositions of sigmoidal functions. Mathematics of Control Signals and Systems 1989;2:303–14.32. Demuth H, Beale M. Neural network toolbox—for use with MATLAB users guide. Massachusetts: The Mathworks Inc, 1993.33. Fiori S, Grimani F, Burrascano P. Novel neural network feature selection procedure by generalization maximization with application to automatic robot guidance. International Journal of Smart Engineering and System Design 2002;4:91–106.
No comments:
Post a Comment